Oil Prices And Events - Shiny App
Summary
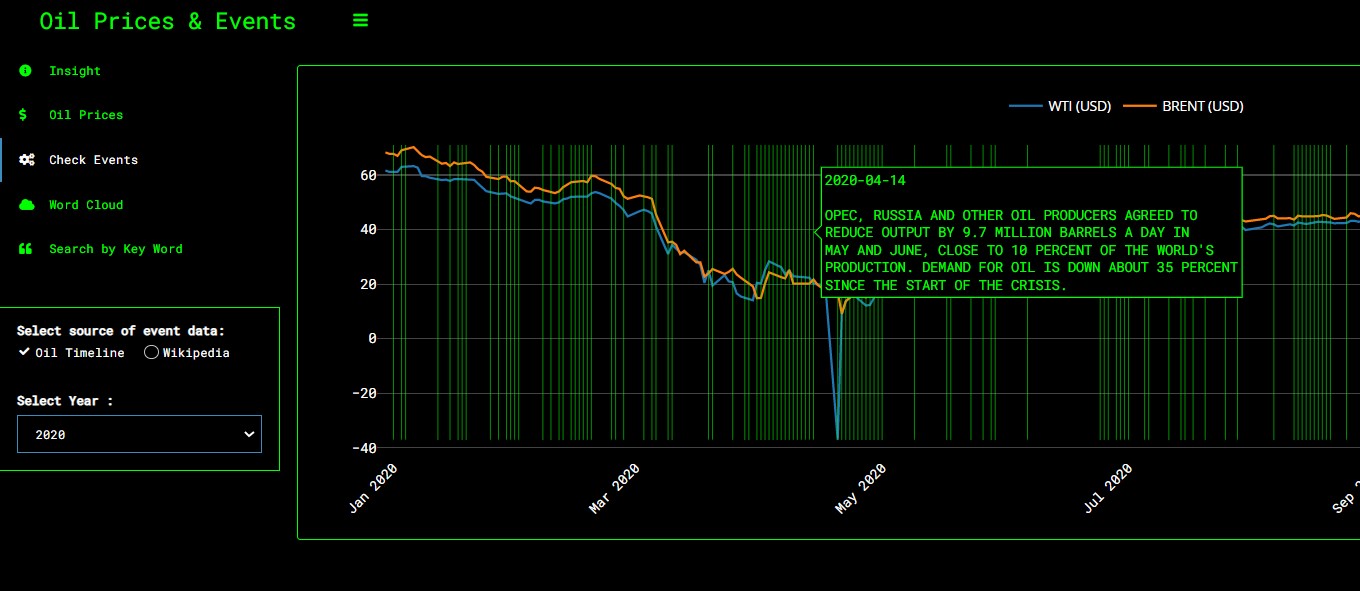
Using this Shiny app, one can visualize oil prices (from 2000 to 2021) and events that may have had an impact on prices.
The idea here is to overlay historical event data on top of a time series graph. The user can select a year and a type of source of event data to be displayed (Oil Timeline or Wikipedia).
Oil prices were retrieved thanks to the U.S. Energy Information Administration API (EIA).
Events were web scrapped using two sources of event data :
Time line database created by Algis Ratnikas (Oil Timeline).
Chronological main events captured in Wikipedia (e.g. Wikipedia 2021).
Oil Prices and Events - Shiny App